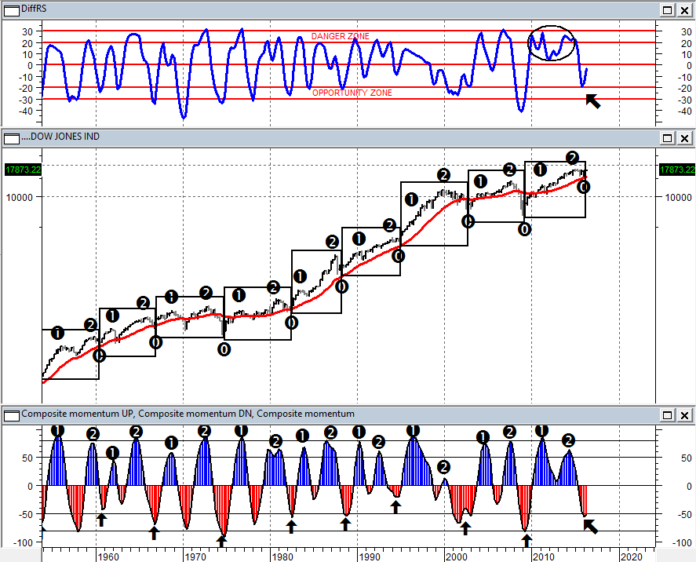
The examination of the US business cycle, then the economic cycle leading economy and the leading stock market, is pointing to a persistent behavioral imperative that we can define “split cycle”. Each cycle (6-8 years from minimum to minimum) is divided into 5 stages:
- ACCELERATION
- CONTRACTION
- EXPANSION
- DISTRIBUTION
- REPRICING
ACCELERATION – The first phase of the cycle, that is marked on the chart as step 1 and starts by the arrow, is characterized by a more important and more precise development linked to a strong economic recovery.
CONTRACTION – Follows what is called a Mid-cycle contraction, to which the central banks have always responded through monetary policy stimulus (lowering of interest rates, quantitative easing, LTRO, Operation Twist etc.).
EXPANSION – After the contraction comes the action of expansive monetary support of the Central Banks, the movement marked in our charts with 2, invariably greater than 1 point.
DISTRIBUTION – On the peak of the second cycle – after step 2, near the end of the complete cycle – manic behavior develops: denial of reality – denial of the excesses and speculative nature of the assessments – risk negation – affirmation of the perpetuation of the positive factors – creation of myths (eg .: 2000, 2008, 2015)
REPRICING – The bear market cycle ends, which then gives place to the next bull market.
In almost all cycles, the second top is equal to/higher than the first and the decline that follows the second top is significant and visible (even in the oscillator) on a quarterly chart.


