After months of lateralization and price squeeze, the speed, which is realized through a re-acceleration of the downtrend, especially on European indices, returns on equity markets. The trend and momentum split between the US and European markets confirms the decoupling taking place between the US and the Old Country, that is impacted by the uncertainties related to the issue BREXIT and strong sales of bank stocks, for months referred to as the weak link and the asset to be avoided until further notice.
WE TREAT ANY EVENT ONLY TO THE EXTENT THAT THIS EVENT HAS AN EFFECT ON THE MARKETS AND POSSIBLY ON THE POSITION OF THE MODELS.
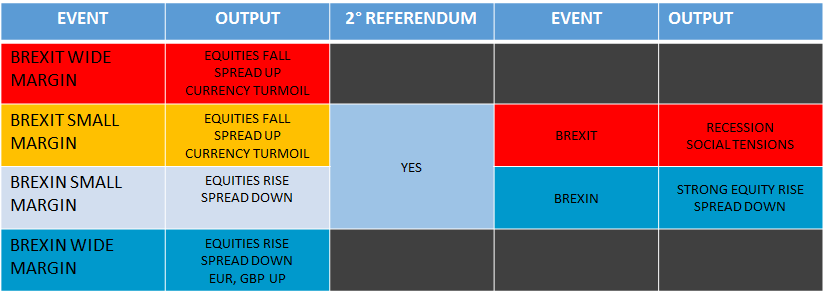
In light of the great thrill and anticipation about this week referendum, we allowed ourselves to summarize in a simple scheme what could be the most likely output. The basis of our reasoning, which of course is just a point of view, is that in case of victory of any of the two parts with little margin, the losing side will in all probability call for a second referendum to validate the results of the referendum, with an extension of the uncertainty phase.
The volatility is increasing.
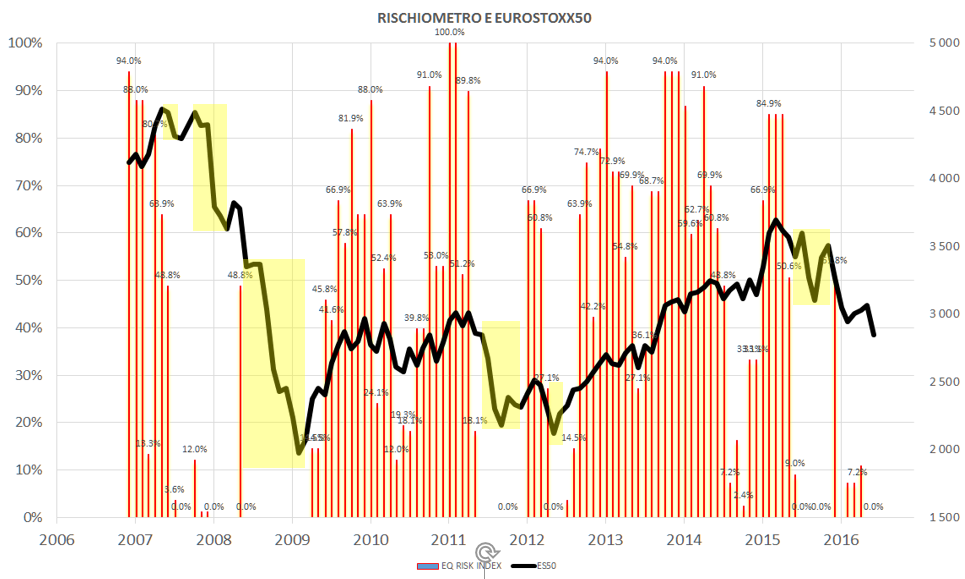
In terms of allocation this does not change anything for our Model Portfolios, which reset again the part in Equity, thanks to the off-setting between the upside position on the S&P500 and the SHORT on Model Portfolio BLACK SWAN on the EUROSTOXX50 and the FTSEMIB. In the past, the zero allocation on the Equity Model Portfolios occurred in correspondence of market’s high volatility phases (yellow areas of the chart above). In phases of this type, being out of the market represents a fundamental advantage in order to protect portfolio and capital.
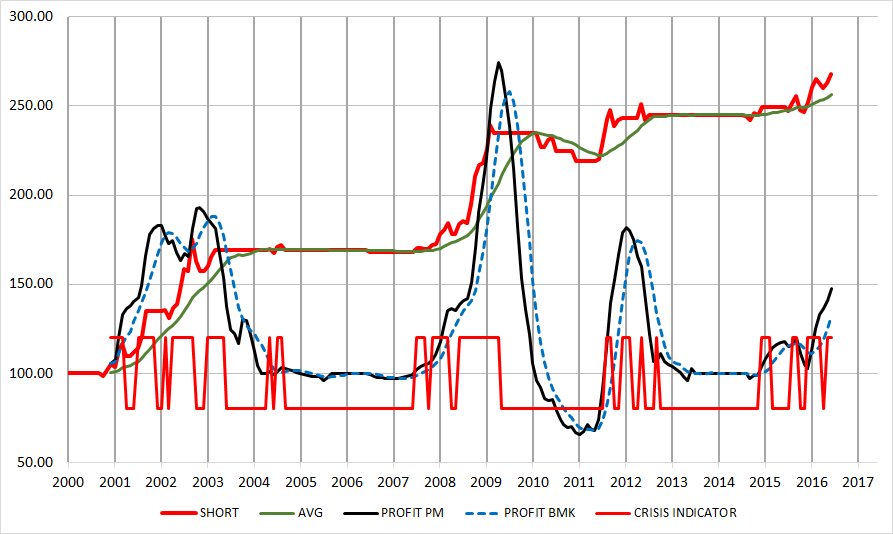
Our Crisis Indicator, which is based solely on an algorithm which selects the negative phases of the trend, is ON and under hard acceleration. As you can see on the chart, this same indicator entered ON months earlier than the Twin Towers, the recession in 2002, the Lehman crash and the acute phases of the crisis on the debt. We believe there is no better comment to this graph (taken from an Excel file) than the simple observation.
NOTE – Currently, our Model Portfolios for 2016 are set on a +3% on average, with much higher peaks of some strategies and a volatility less than that of many bond indices. Almost no strategy and no absolute return or Balanced fund got this result.


