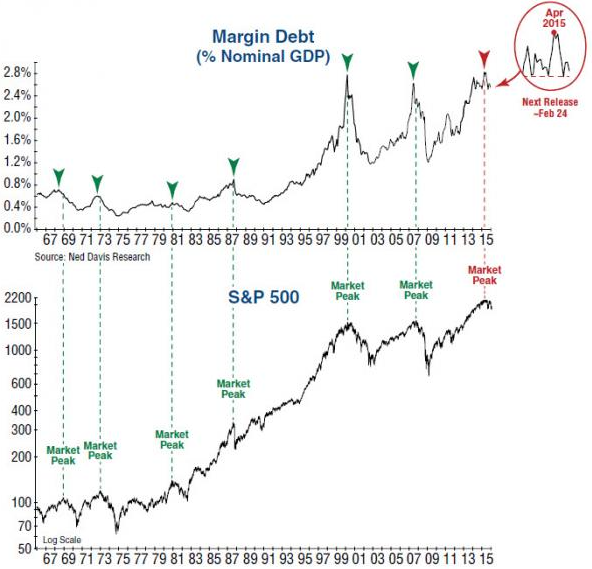
The latest figure of NYSE Margin Debt (briefly: leverage, that is, the net level present on the US financial market debt) was still down compared to the record high and less than the minimum recorded in September of 2015, whose next retracement led to the temporary US index recovery.
The figure on the leverage now joins a long list of elements of the American market valuation (capitalization/GDP, Shiller P/E etc.) that in 2015 have touched excesses of multi-year assessment.
 – Leverage – NYSE Margin Debt Net (inverted scale) – Monthly Chart – From 1992-2016 Source data: nyxdata.com –
In particular, in 2015 the US leverage (which we define as the most important support component to speculation) has reached unprecedented peaks, thanks to the ease of indebtedness of individuals and companies (buybacks). The Margin Debt top was recorded in April 2015, at the beginning of an era of not only and not so much deterioration in the equity markets, but, in the broadest sense, of decline in asset profitability.
The analysis of the time series data (which only goes back to 1992) shows between 2015 and 2016 a series of distribution correlation between S&P and Margin Debt – shown on the chart with the number sequence – which has strong similarities to those of the two top previous, 2000 and 2007. A monthly close of S & P below 1920 is necessary to confirm the drilling of point 4 and – presumably – to kick off a contraction of the speculative component, which also took place at all major declines of the past.
It should be emphasized that the data of the NYSE Margin Debt are several weeks older than their publication, then, although it is an interesting indicator, an important change in Margin Debt is not immediately apparent.
Conclusion – There are too few episodes of highs and lows in this series to get the latest data as a leading indicator of an impending selloff on US equities, which in any case are the strongest index and – because of its internal composition – the most resistant in the declining stages. However, the current level of leverage is still very high and shows a pattern similar to the one seen after the market peak in 2000 and 2007. This was an interesting indicator to look into the past and will certainly continue to be an indicator to keep under close obeservation for the foreseeable future, given its obvious direct correlation with the leading stock market trend.


